GNS Science, a New Zealand Crown Research Institute, is the leading provider of research and consultancy services surrounding geology, geophysics, and nuclear science. NZMS’s Wellington team recently received some fascinating work from GNS who requested digitisation of their unique and valuable collection of historical magnetograms.
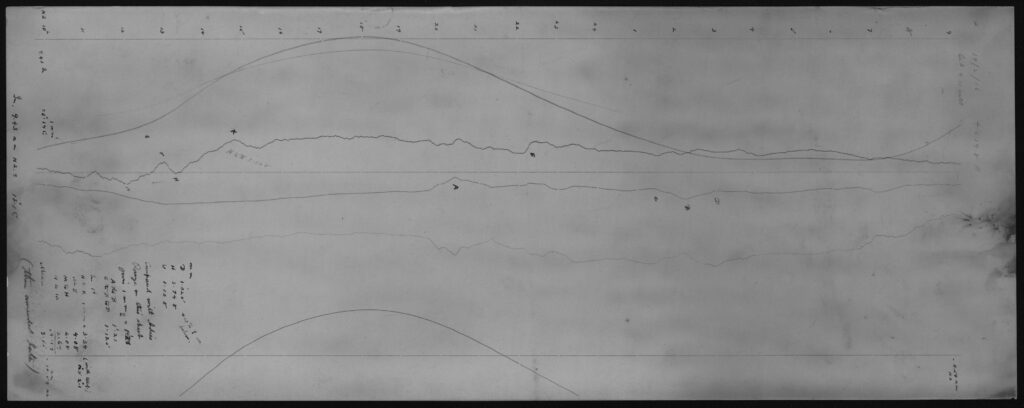
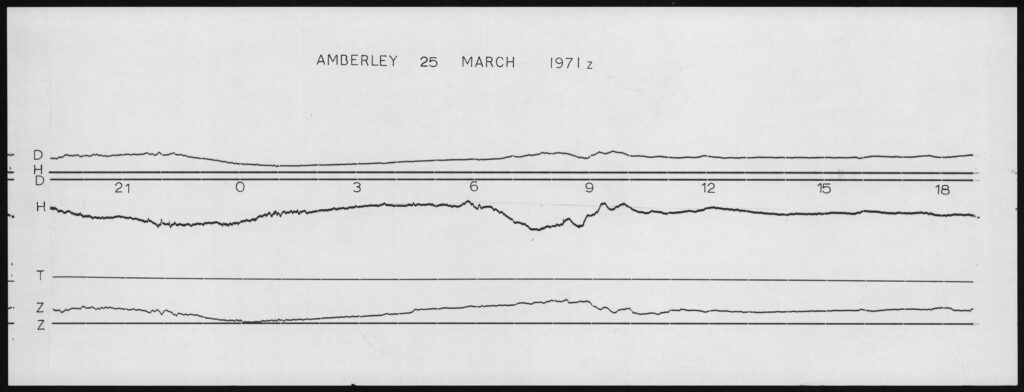
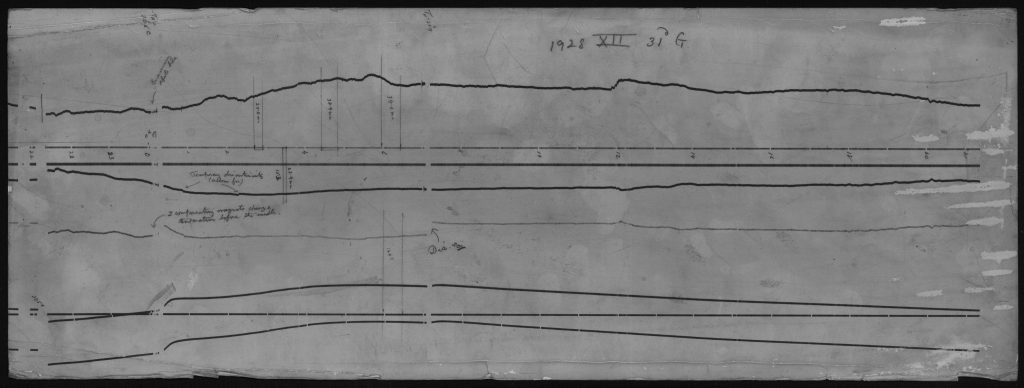
These magnetograms date from 1916 to 1991, and our team digitised almost 22,000 of them over five tranches. Historic magnetograms, which look vastly different to contemporary examples, are recorded on photographic paper and reveal the variations in the strength and direction of the Earth’s magnetic field. They supply data that can be used to study the evolution of the Earth’s magnetic field, as well as predict geomagnetic storms and space weather.
This knowledge is important to GNS scientists because they aim to improve New Zealand’s economic, environmental, and social benefits through understanding the processes and resources that exist within natural Earth systems (the hydrosphere, geosphere, atmosphere, and biosphere).
Estimating the future by looking into the past
Dr Tanja Petersen, GNS scientist, describes how studying historic magnetograms can help predict future events like geomagnetic storms:
“The Earth’s magnetic field acts as a shield that protects us from most of the particles the sun emits. At times the constant stream of solar particles is stronger and so called ‘geomagnetic storms’ are being produced.
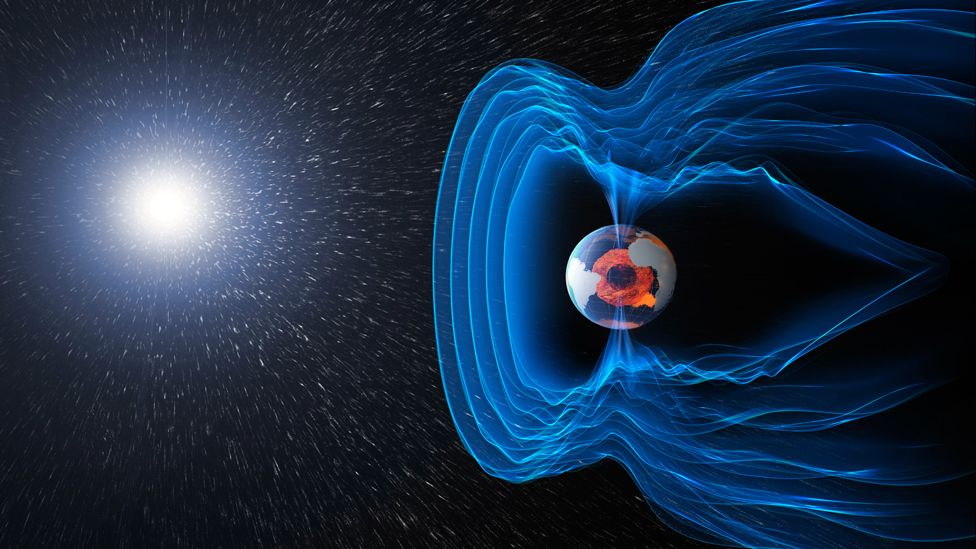
While large geomagnetic storms create beautiful auroras, they can also be hazardous to the activities and technological infrastructure of modern civilization. An extreme storm, for example, is likely to produce a collapse of the electrical power grid. We are measuring these storms here in New Zealand by continuously monitoring the magnetic field variations at a geomagnetic observatory near Christchurch.
Statistical analysis can be used to help answer when these storms will occur, but this analysis relies on long historical observation records in digital format. New Zealand historic magnetic field observations (‘magnetograms’) exist since 1901 and are continuous since 1916, but the data is only available in digital format from 1994 — i.e., less than 25 years.”
Tanja explained that by having their historical magnetograms digitised, GNS can extend its digital dataset and enable a University of Otago research group to perform more comprehensive statistical analysis. This research will be able to determine the likelihood (and consequences) for future extreme geomagnetic storms that could impact New Zealand.
Magnetogram digitisation
GNS’s magnetograms were delivered to our Wellington branch in boxes divided up by year — each box contained around 365 items with one magnetogram having been recorded every 24 hours. The magnetograms varied in condition and some, mostly those recorded in the 1920s and 1930s, were very curled and brittle. The curled magnetograms required careful handling by our technicians to ensure they were kept flat in the scanner and that the entire graph could be captured.
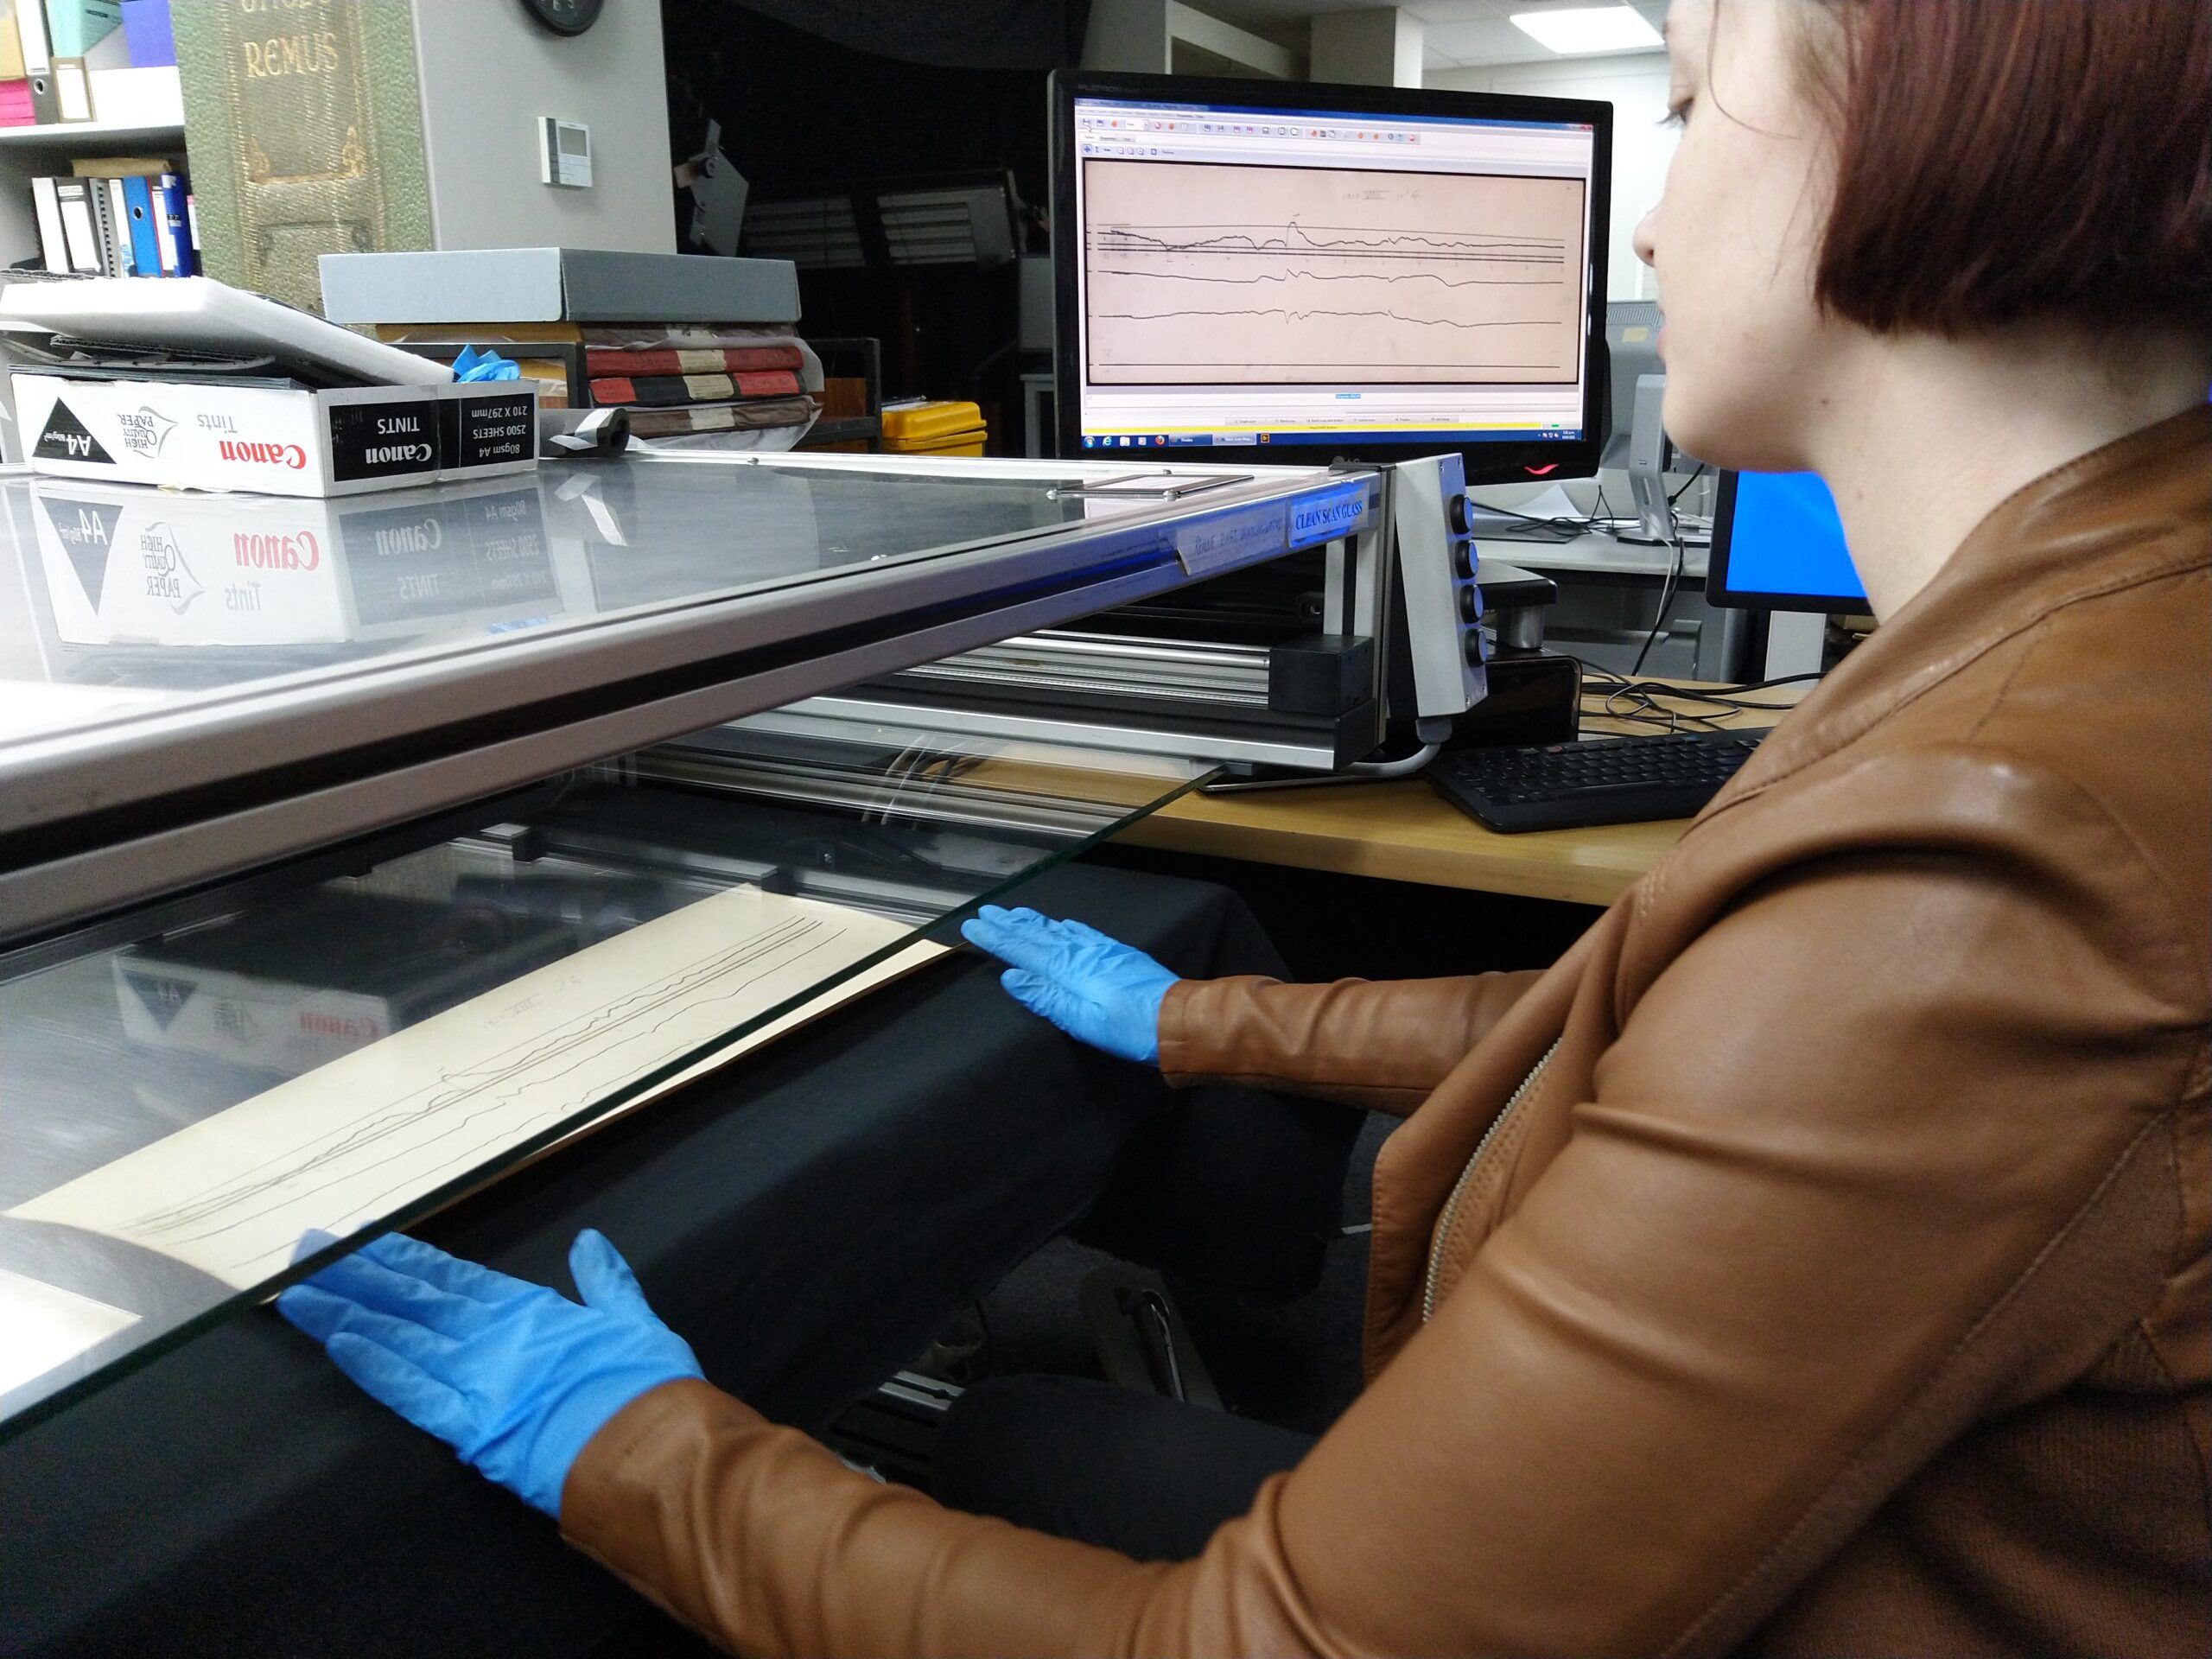
We used an SMA ScanMaster 1 to digitise the magnetograms to 600ppi and ensure a superb level of detail. The SMA gently flattened the items so we could produce an exact copy of the plotted magnetograms. Our team performed comprehensive quality control checks on each image and renamed the files based on the date marked on each magnetogram.
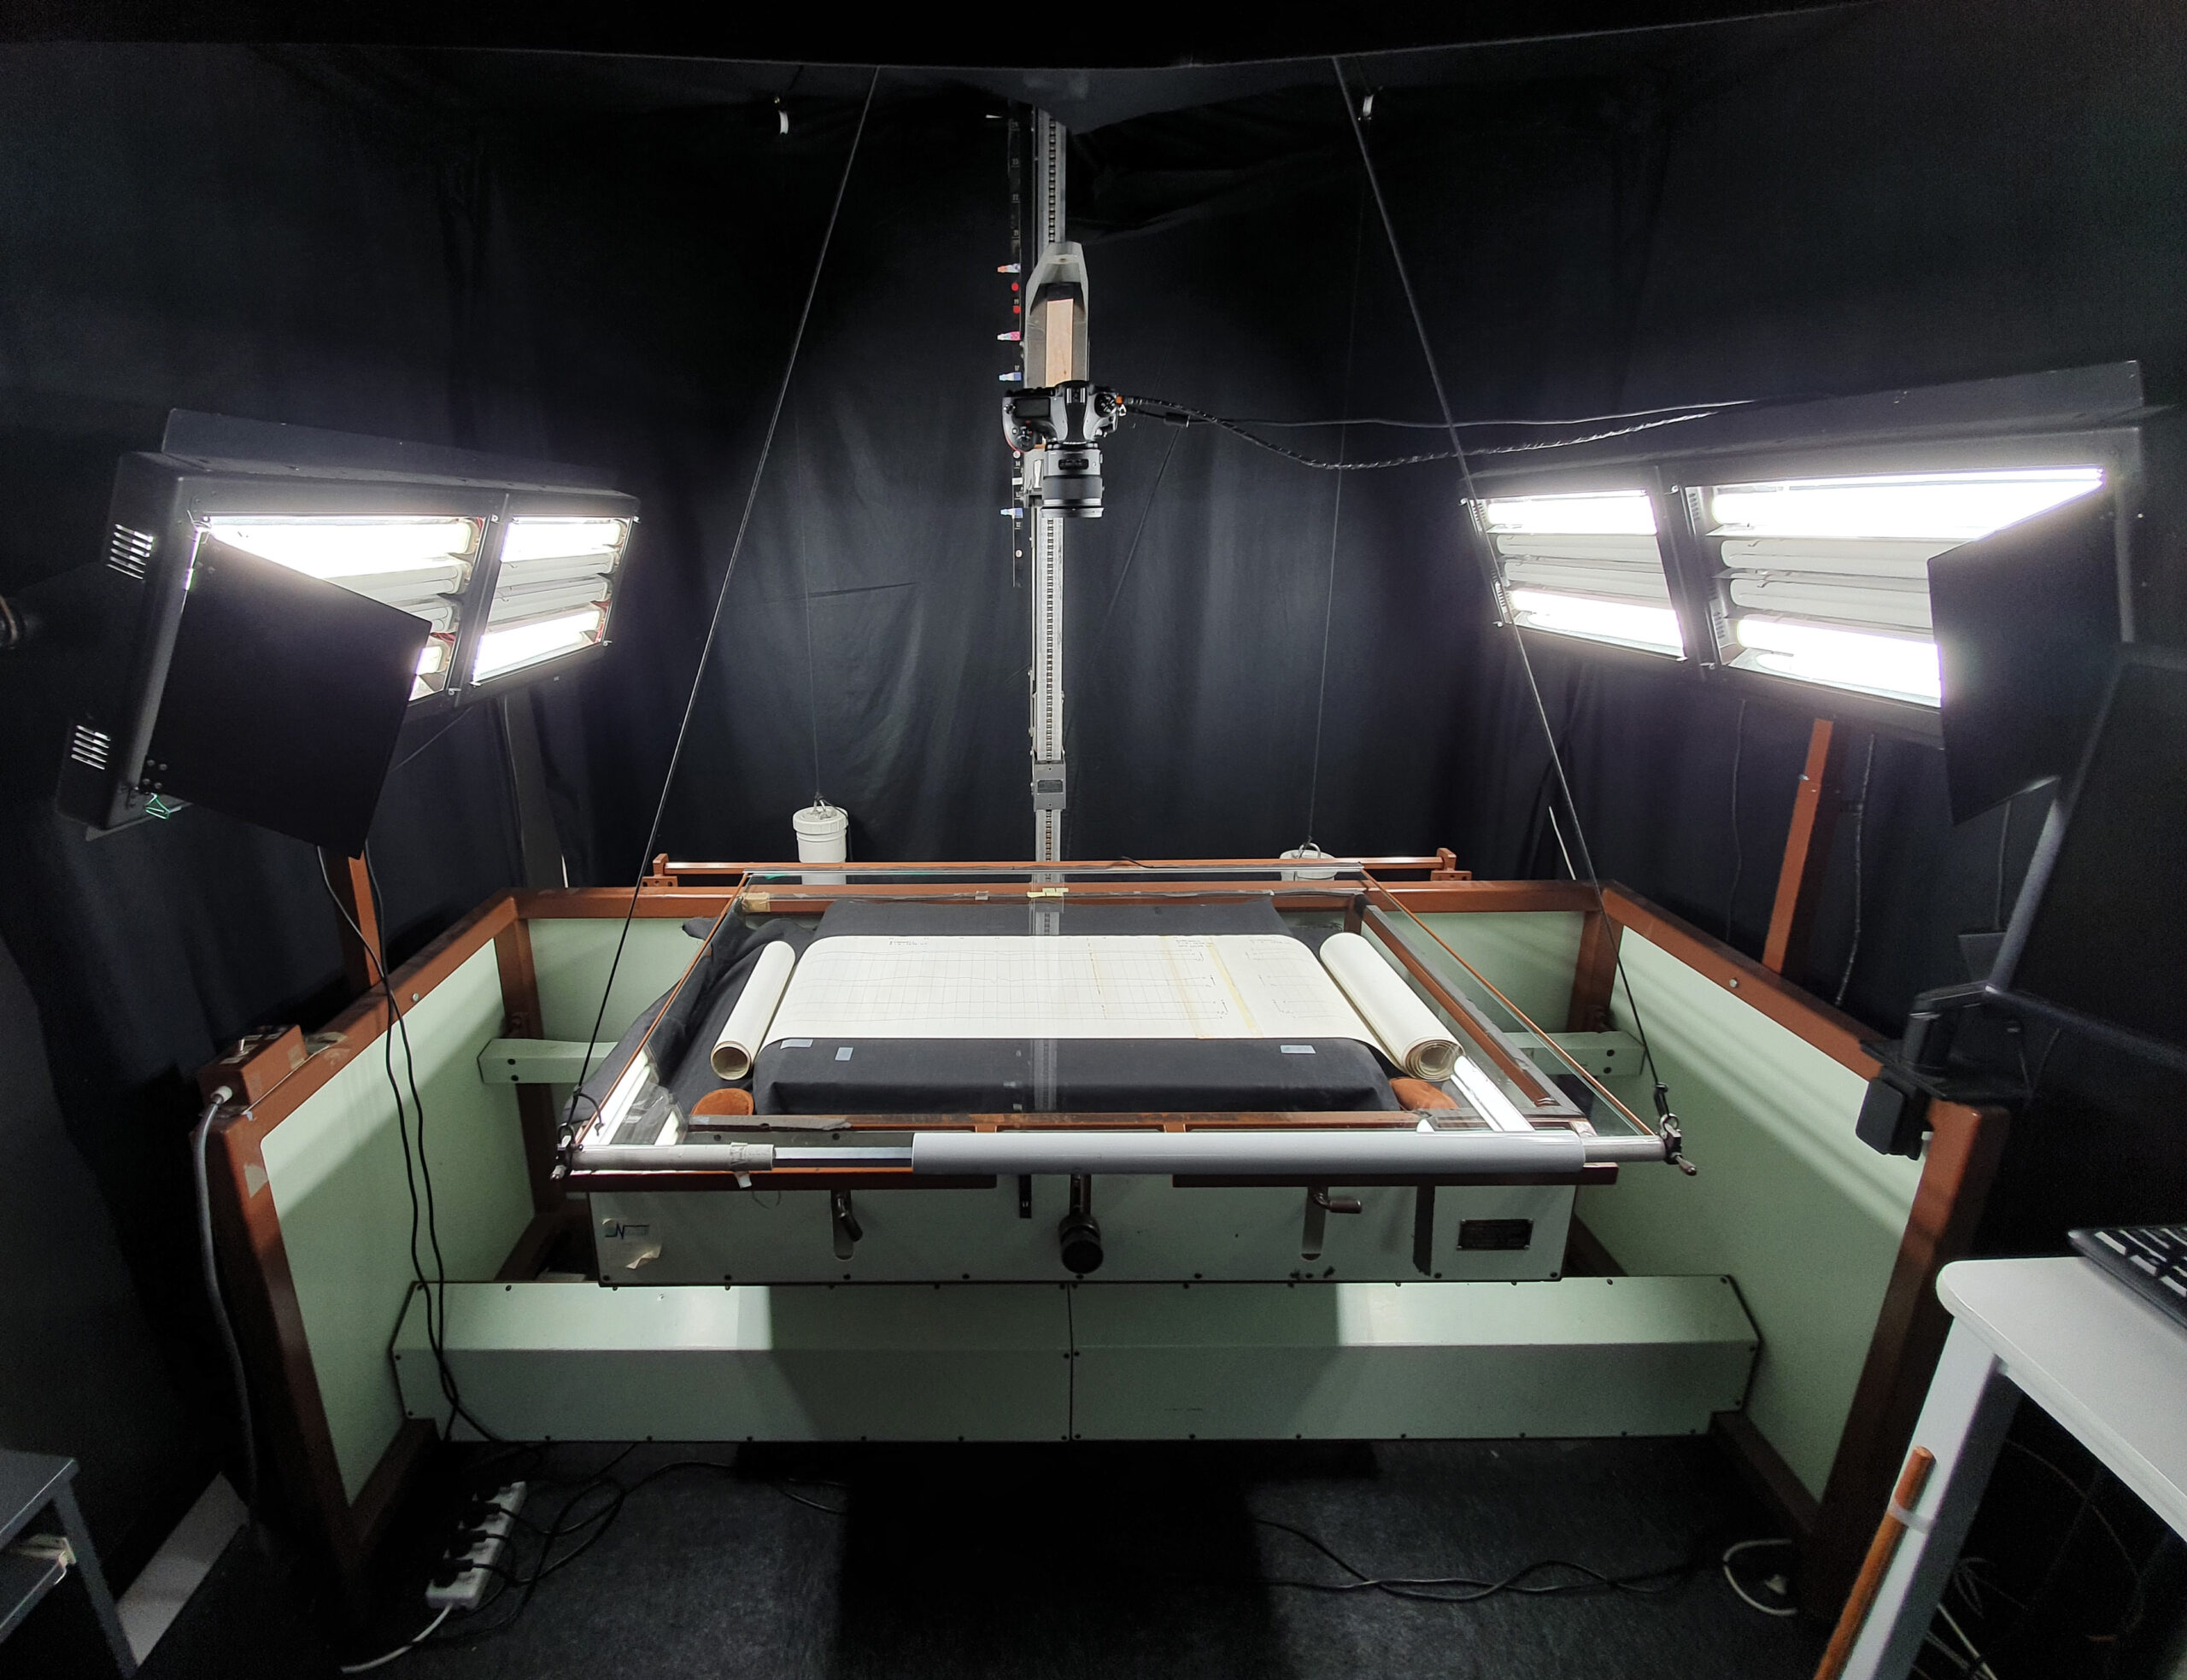
Our Wellington team are currently working on an additional batch of magnetograms from GNS, some of which include recordings on very long continuous rolls that each make up two months. We had to develop an alternative process to capture these magnetograms because of their size. In the end, they were digitised with a Nikon D850 camera over a modified book cradle, this method meant that the rolls could lie flat and we could produce the best possible image.
Once all the magnetograms have been digitised, GNS scientists will use them to trace the lines that are present in the magnetic measurements and calculate values for the varying magnetic field strengths over time. A database will then be established so that the magnetogram images and digital traces are freely available to scientists around the world.
Our team at NZMS are trained to offer you the best solution — no matter what items you have in your collections. Contact us today for a quote!